News
Evaluating the representation of atmospheric ammonia in UKESM1 utilising Earth Observation data
Richard Pope1,2, Catherine Hardacre3,4
1 School of Earth and Environment, University of Leeds; 2 National Centre for Earth Observation, University of Leeds; 3 School of Physical & Chemical Sciences, University of Canterbury, NZ; 4 Met Office, Exeter.

Motivation
Atmospheric aerosols (solid or liquid particles suspended in the atmosphere) represent an important component of the Earth system. As a hazardous air pollutant, aerosols (e.g. particulate matter with a diameter < 2.5 µm – PM2.5) can have adverse impacts on human health (e.g. respiratory or cardiovascular diseases). Aerosols also influence our climate directly (e.g. by scattering of incoming solar radiation) and/or indirectly (e.g. by perturbing cloud properties), which remains a large uncertainty in our understanding of climate change. Some aerosols like black carbon from combustion (e.g. traffic, wildfires) act as a warming agent, while sulphur-induced aerosols (e.g. emitted from volcanoes, industry) can yield a cooling effect.
To investigate the climatic impact of atmospheric aerosols, researchers across NERC and at the UK Met Office developed the first version of the UK Earth System Model (UKESM1). UKESM1 combines different components of the Earth system to simulate the historical, present and potential future evolution of the coupled Earth system. One aerosol component not included in UKESM1 is nitrate aerosol.
Nitrate aerosol is formed by the reaction of ammonia (NH3) with nitric acid (HNO3) in a temperature dependent, and reversible, process described by:
HNO3 + NH3 ↔ NH4NO3 Reaction 1
Both NH3 and HNO3 are gas phase species but the forward reaction causes the condensation of both species yielding ammonium nitrate (NH4NO3) in the aerosol phase. However, in the opposite direction, the evaporation of ammonium nitrate reforms NH3 and HNO3 in the gas phase. The equilibruim constant, Kp, is determined from the parameterization of Mozurkewich et al., (1993) and depends on the temperature and the deliquescence relative humidity. However, the amount of NH3 available to form NH4NO3 is also dependent on sulphate concentrations, because NH3 will react irreversibly with sulphate to form (NH4)2SO4.
Ammonium nitrate is an important contributor to near-surface aerosol load, e.g. in urban regions, and can adversely influence air quality (Jimenez et al., 2009). This is why regional air quality forecast models, such as the Met Office air quality forecast model (Savage et al., 2013), include representations of nitrate aerosol. Studies have also shown that ammonium nitrate can have a substantial influence on the Earth’s radiation budget. Thus, it is an important atmospheric constituent to represent realistically in UKESM1. While satellites do not directly retrieve ammonium nitrate, NH3 is observed by several space-based sensors (e.g. the Infrared Atmospheric Sounding Interferometer – IASI). This work evaluates an updated UKESM1 configuration where a new nitrate scheme has been added. Earth observation data is used to assess the models skill in simulating observed spatiotemporal patterns and variability in total column NH3 (TCNH3), thus providing an indirect constraint on the simulated ammonium nitrate in the model.
UKESM1.1
UKESM1.1 is an updated configuration of UKESM and has a much-improved historical temperature simulation compared to UKESM1 (Mulcahy et al., 2023). A new nitrate aerosol scheme has been implemented and tested in UKESM1.1 (UKESM1.1-nitrate) as part of our development towards UKESM2. Here, we use the atmosphere-only (AMIP) configuration of the UKESM1.1 model to evaluate the new scheme. The set-up of the AMIP configuration is as used for CMIP6 (Coupled Model Intercomparison Project 6) and is described in Sellar et al. (2020). Briefly, the model uses prescribed sea surface temperatures and sea ice derived from observations and does not simulate the terrestrial or marine carbon cycle. Other climate drivers such as the anthropogenic emissions of trace gases and aerosols, solar cycle and stratospheric aerosols are prescribed from CMIP6 forcing data (see description and further references in Sellar et al., 2020). Fire emissions are prescribed from the Global Fire Emissions Database version 4. Atmospheric chemistry and aerosols are prognostic variables in UKESM1.1, simulated by the UK Chemistry and Aerosols (UKCA) model which includes the stratospheric-tropospheric chemistry scheme, StratTrop v1.0 (Archibald et al. 2020) scheme and the GLOMAP-mode aerosol scheme (Mulcahy et al. 2020).
A nitrate aerosol scheme was recently implemented into UKCA by Jones et al. (2021) and is based on the approach taken by Hauglustaine et al., (2014) and Rémy et al., (2019). In this scheme NH4NO3 is emitted into the Aitken and accumulation aerosol size modes depending on its equilibrium concentration (see Reaction 1) and can then be transferred to the coarse mode during aerosol processing. NO3‑ mass can also condense onto sea salt and dust particles in the accumulation and coarse modes. An important consideration for simulating nitrate aerosol is the time taken to reach an equilibrium NH4NO3 concentration. This depends on temperature, relative humidity, the aerosol size and the uptake co-efficient, γ. The uptake co-efficient is used to determine the uptake rate of HNO3 on to an aerosol particle and in UKCA it is determined for each aerosol mode. The uptake coefficient (γ) is poorly constrained by observations. Jones et al., (2021) tested two γ values that represented the observed range to explore model sensitivity to HNO3 uptake onto aerosol and thus how quickly NH4NO3 reaches equilibrium. In the “FAST” experiment γ=0.193 and NH4NO3 reaches equilibrium quickly, while in the “SLOW” experiment γ=0.001 and NH4NO3 reached equilibrium slowly. Both γ values have been also tested in UKESM1.1-nitrate with SLOW generally performing better overall when compared against observations of atmospheric composition, aerosol and cloud properties and climate. Here we focus on the comparison of TCNH3 from both UKESM1.1-nitrate FAST and SLOW simulations against satellite retrievals.
Satellite data
IASI is a Michelson interferometer with a nadir-viewing spectral range between 645 and 2760 cm−1 with spectral sampling of 0.25 cm−1. It measures simultaneously in four fields of view (each circular at nadir with a diameter of 12 km) in a 50 × 50 km square which are scanned across track to sample a 2200 km wide swath. IASI, onboard EUMETSAT’s MetOp-A satellite, is in a sun-synchronous polar orbit with Equator crossing local times of 09:30 and 21:30. Here, we use IASI TCNH3 from the AERIS portal. The product is based on the Artificial Neural Network for IASI (ANNI – version 4) algorithm. Figure 1 shows the monthly mean IASI TCNH3 between January 2008 and December 2020.
Figure 1: IASI TCNH3 (×10-4 mol/m2) between January 2008 and December 2020. White space means no available data.
Results
Overall, UKESM1.1-nitrate captures the IASI TCNH3 spatial distribution for December-January-February (DJF) and June-July-August (JJA) seasons covering 2008 and 2013 (Figure 2a-d). The model simulates large NH3 hotspots over India and East Asia (>3.0 ×10⁻⁴ mol/m2) with secondary peaks (2.0-3.0×10⁻⁴ mol/m2) over Europe, North America and Central Africa. IASI detects similar TCNH3 levels but with a slightly larger background signal (e.g. 0.25-0.5 ×10⁻⁴ mol/m2). When considering the UKESM1-IASI TCNH3 difference (Figures 2e & f), some features become more prominent. Over Europe and North America, there are some moderate positive biases of up to 0.5 ×10⁻⁴ mol/m2. However, there are more substantial positive biases over India and China (up to 1.0 ×10⁻⁴ mol/m2). Here, the absolute bias is larger than the satellite error meaning the model is unable to simulate TCNH3 within the uncertainty range of the observations. These regions are dominated by anthropogenic NH3 emissions suggesting potential problems in the prescribed input data to the model for example, agricultural emissions of NH3. Over Central Africa and South America, there are substantial negative biases of greater than -1.0 ×10⁻⁴ mol/m2. These are key biomass burning and wildfire regions, indicating that here the model potentially misrepresents emissions from fires, which are prescribed in this model configuration. The background differences (approximately -0.2 to 0.0 ×10⁻⁴ mol/m2) are small and within the satellite uncertainty range.
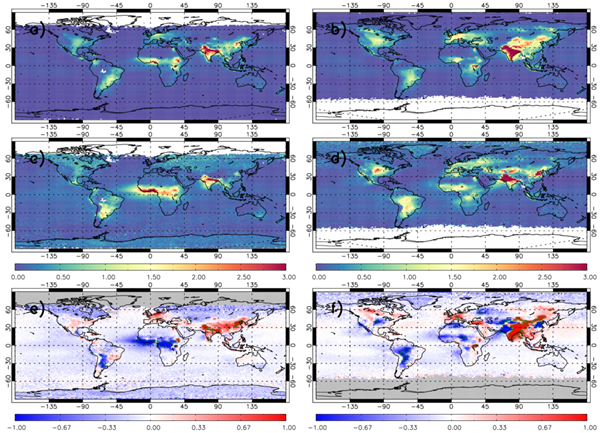
Figure 2: TCNH3 (×10-4 mol/m2) averaged between 2008 and 2013 for a) UKESM1.1-nitrate SLOW December-January-February (DJF), b) UKESM1.1-nitrate SLOW June-July-August (JJA), c) IASI DJF, d) IASI JJA, e) SLOW-IASI difference DJF and f) UKESM1-IASI difference JJA. Green polygon-outlined regions show substantial differences where the absolute mean bias > the satellite error. White (a-d) and grey (e-f) shading indicates missing data.
To investigate the time evolution and potential discrepancies between the model and IASI, we use a land mask for large anthropogenic regions (Figure 3) to derive monthly mean regional averages of TCNH3 (Figure 4). As can be seen in the model emissions (Figure 3), North America, Europe, Southern Asia and East Asia are the largest NH3 emitters, so provide the focus for our time-series analysis. Both Southern and Eastern Asia have peak emissions >50 ×10-12 kg/m2/s, while Europe and North America are lower at 35.0-45.0 and 25-35 ×10-12 kg/m2/s, respectively.
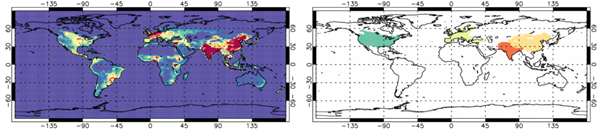
Figure 3: UKESM1 NH3 emissions (10-12 kg/m2/s) from CMIP6 (2008-2013) in the left panel and land mask of North America, Europe, Southern Asia and East Asia in the right panel. The land masks are used to generate regional TCNH3 time-series for UKESM1 and IASI.
Figure 4 compares the TCNH3 timeseries of SLOW (green line) and FAST (red line) simulations against IASI (blue line). Also plotted are the emissions of NH3 as prescribed by CMIP6 (black line).
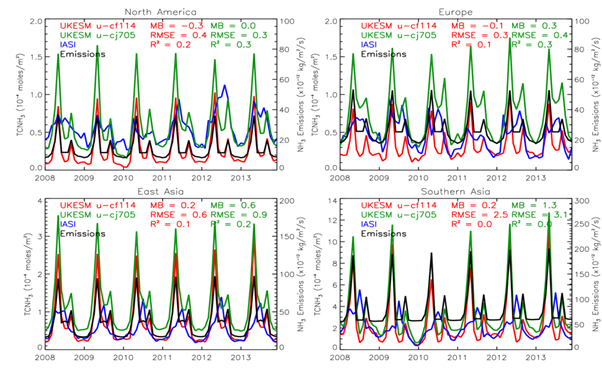
Figure 4: TCNH3 (×10-4 mol/m2) averaged over North America (top-left panel), Europe (top-right panel), East Asia (bottom-left panel) and Southern Asia (bottom-right panel). The red, green, blue and black time-series represent respectively TCNH3 from the UKESM1.1-nitrate FAST, UKESM1.1-nitrate SLOW simulation, IASI and the CMIP6 NH3 emissions (second y-axis). MB = mean bias, RMSE = root mean square error and R2= correlation squared.
For North America and Europe, TCNH3 in the control run (experiment) ranges between 0.5 and 1.5 (0.1 and 0.9) ×10-4 mol/m2 with peak values in spring and then a secondary peak in autumn (Figure 4 top-left & top-right panels). The simulated TCNH3 time-series correlate well with the input emissions, which is to be expected. However, there is less agreement when compared with IASI. In absolute terms, the best agreement is between the SLOW simulation and IASI for North America with an overall mean bias (MB) of 0.0 and a root mean square error (RMSE) of 0.3×10⁻⁴ mol/m2. The experiment has an MB of -0.3 and an RMSE of 0.4. The SLOW simulation has a slightly better representation of the temporal evolution of TCNH3 (i.e. R2 (correlation squared) = 0.3 compared to 0.2). For Europe, the opposite occurs where FAST agrees better with IASI (MB = -0.1 ×10⁻⁴ mol/m2 vs. 0.3×10⁻⁴ mol/m2, RMSE=0.3×10⁻⁴ mol/m2 vs. 0.4×10⁻⁴ mol/m2) in absolute terms but the temporal evolution is more accurately captured in SLOW (R2=0.3 vs. R2=0.1).
For East Asia (Figure 4 bottom-left panel), TCNH3 in SLOW ranges between 0.5 and 3.5 (0.25 and 2.5) ×10-4 mol/m2. In Southern Asia (Figure 4 bottom-right panel), TCNH3 in SLOW ranges between 2.0 and 12.0 (0.5 and 10.0) ×10-4 mol/m2. Therefore, UKESM1 simulates much larger TCNH3 in Southern Asia where large agricultural emissions are produced (e.g. ~200 ×10-12 kg/m2/s in Southern Asia vs. ~100×10-4 mol/m2 in East Asia). Here, both model simulations are substantially larger than IASI where the MB ranges between 0.2 and 1.3×10⁻⁴ mol/m2 and the RMSE ranges between 0.6 and 3.1×10⁻⁴ mol/m2. The temporal evolution of the model is also poor with R2 peaking at 0.2 (0.0) for East Asia (Southern Asia). Therefore, the emissions appear to be substantially overestimated in the model, independent of the HNO3 uptake efficiency rate. Secondly, IASI has one seasonal peak in summer while the model retains two peaks in spring and autumn. This is because the emissions profile used in the CMIP6 emissions for NH3 is based on European agricultural practices and not representative of those in Asia, especially India.
Summary
Overall, UKESM1.1-nitrate successfully captures the spatial distribution of NH3 in the satellite observations and correctly simulates the seasonal cycles for North America and Europe. However, for East Asia and Southern Asia, we find that UKESM1 overestimates the NH3 levels possibly due to the prescribed CMIP6 NH3 emissions being too large over these two regions. There are also issues with how UKESM1.1-nitrate simulates the Asian NH3 seasonal cycle in the model. This is likely due to European emission profiles for agriculture being used to represent those in Asia and in particular India. This is not realistic, and our analysis demonstrates the usefulness of satellite observations from IASI pinpoint issues in the model.
Moving forward, representation of agricultural NH3 in the model will need attention. This will also be important as biases in the modelled NH3 from emissions will indirectly impact on the ammonium nitrate in the model. Ammonium nitrate is an important aerosol component which needs to be simulated effectively as it directly impacts surface air quality and the aerosol radiative forcing.
References
Jimenez, J. L. et al.: Evolution of organic aerosols in the atmosphere, Science, 326, 1525–1529, https://doi.org/10.1126/science.1180353, 2009.
Bian, H. et al.: Investigation of global particulate nitrate from the AeroCom phase III experiment, Atmos. Chem. Phys., 17, 12911–12940, https://doi.org/10.5194/acp-17-12911-2017, 2017.
Savage, N. H. et al.: Air quality modelling using the Met Office Unified Model (AQUM OS24-26): model description and initial evaluation, Geosci. Model Dev., 6, 353–372, https://doi.org/10.5194/gmd-6-353-2013, 2013.
Mozurkewich, M.: The dissociation constant of ammonium nitrate and its dependence on temperature, relative humidity and particle size, Atmos. Environ. A-Gen., 27, 261–270, 1993.
Mulcahy, J. P. et al.: UKESM1.1: development and evaluation of an updated configuration of the UK Earth System Model, Geosci. Model Dev., 16, 1569–1600, 2023 https://doi.org/10.5194/gmd-16-1569-2023
Archibald, A. T. et al.: Description and evaluation of the UKCA stratosphere–troposphere chemistry scheme (Strat-Trop vn 1.0) implemented in UKESM1, Geosci. Model Dev., 13, 1223–1266, https://doi.org/10.5194/gmd-13-1223-2020, 2020.
Mulcahy, J. P. et al.: Description and evaluation of aerosol in UKESM1 and HadGEM3-GC3.1 MIP6 historical simulations, Geosci. Model Dev., 13, 6383–6423, https://doi.org/10.5194/gmd-13-6383-2020, 2020.Jones et al. (2021)
Hauglustaine, D. A., et al.: A global model simulation of present and future nitrate aerosols and their direct radiative forcing of climate, Atmos. Chem. Phys., 14, 11031–11063, https://doi.org/10.5194/acp-14-11031-2014, 2014.
Rémy, S. et al.,: Description and evaluation of the tropospheric aerosol scheme in the European Centre for Medium-Range Weather Forecasts (ECMWF) Integrated Forecasting System (IFS-AER, cycle 45R1), Geosci. Model Dev., 12, 4627–4659, https://doi.org/10.5194/gmd-12-4627-2019, 2019.
Sellar, A. A., et al. (2020). Implementation of U.K. Earth system models for CMIP6. Journal of Advances in Modeling Earth Systems, 12, e2019MS001946. https://doi.org/10.1029/2019MS001946